Data Visualization Health Insurance
Project Description
This was the second Data Visualization project I did for my Elements of Data Visualization computer science course. There are a total of 3 plots in this project. This dataset was referenced in a September 1998 article written by Craig Olson in the Journal of Applied Econometrics. The data was used to determine the validity of the hypothesis that wives who do not have health insurance through their husband’s employer are more likely to work full-time to get health insurance than wives who are covered by their husband’s health insurance. I worked collaboratively on this project with my partner, Chenchao Zhang.
Project Details
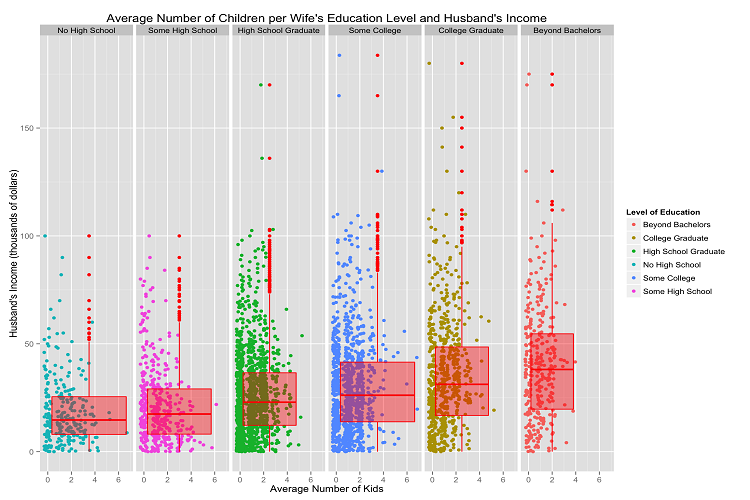
- Plot 1: Average Number of Children per Wife’s Education Level and Husband’s Income
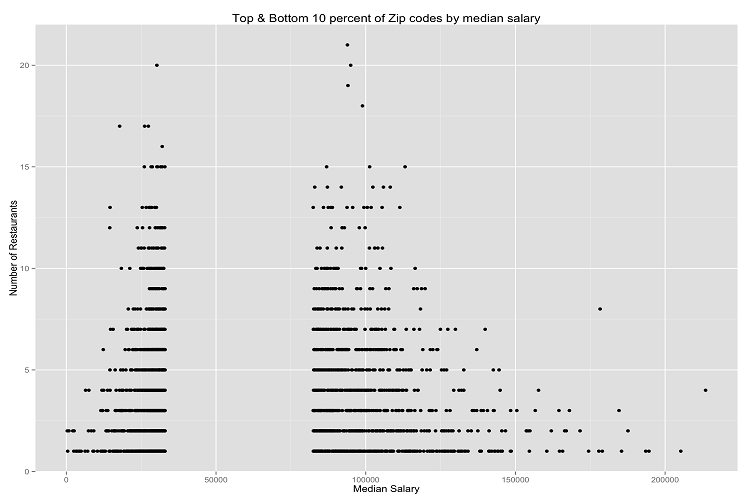
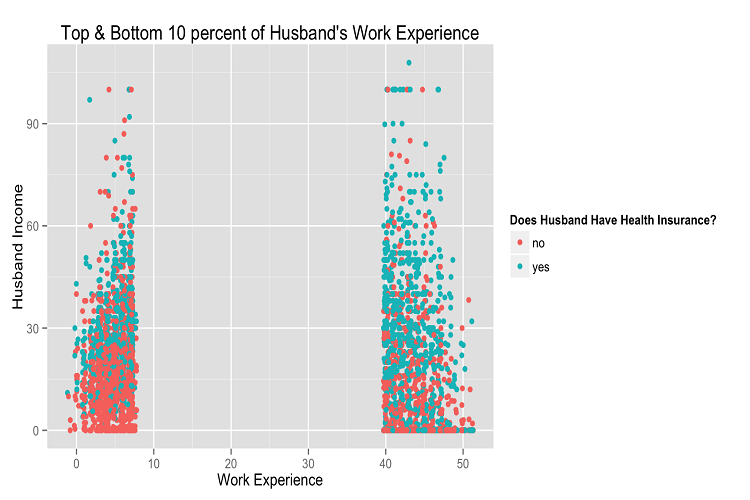
- Plot 2: Top and Bottom 10 Percent of Husband’s Work Experience
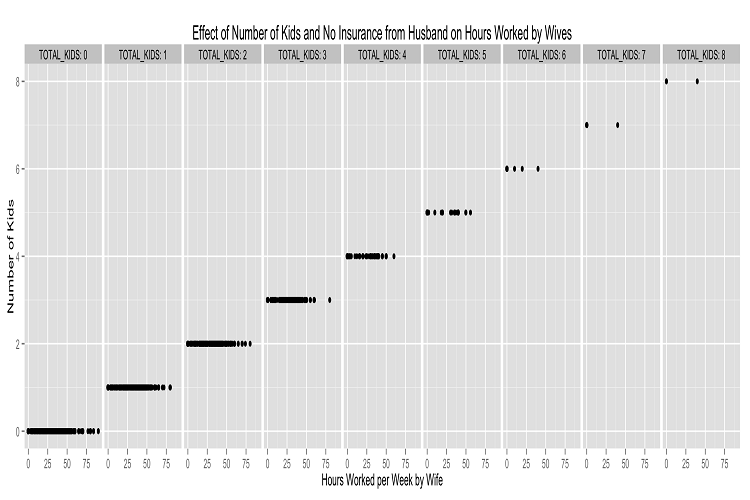
- Plot 3: Influence of Number of Kids and No Health Insurance from Husband on Hours Worked by Wives
Interesting Observations
The boxplots in Plot 1 reveal an interesting trend: the higher the wife's education level is, the higher the husband's income is. Plot 2 shows that husbands in the top 10 percent of work experience (greater than 40 years) are almost 6 times as likely to have health insurance than husbands who are in the bottom 10 percent of work experience (less than ten years). Plot 3 reveals a trend that even when a husband does not have health insurance, the wife will work less hours per week as the family has more children.