Data Visualization Titanic
Project Description
This was the first Data Visualization project I did for my Elements of Data Visualization computer science course. There are a total of 6 plots in this project. The data powering the plots is from a former students dataset that I no longer have access to but is based on the Titanic dataset found in RStudio. I worked collaboratively on this project with my partner, Chenchao Zhang.
Project Details
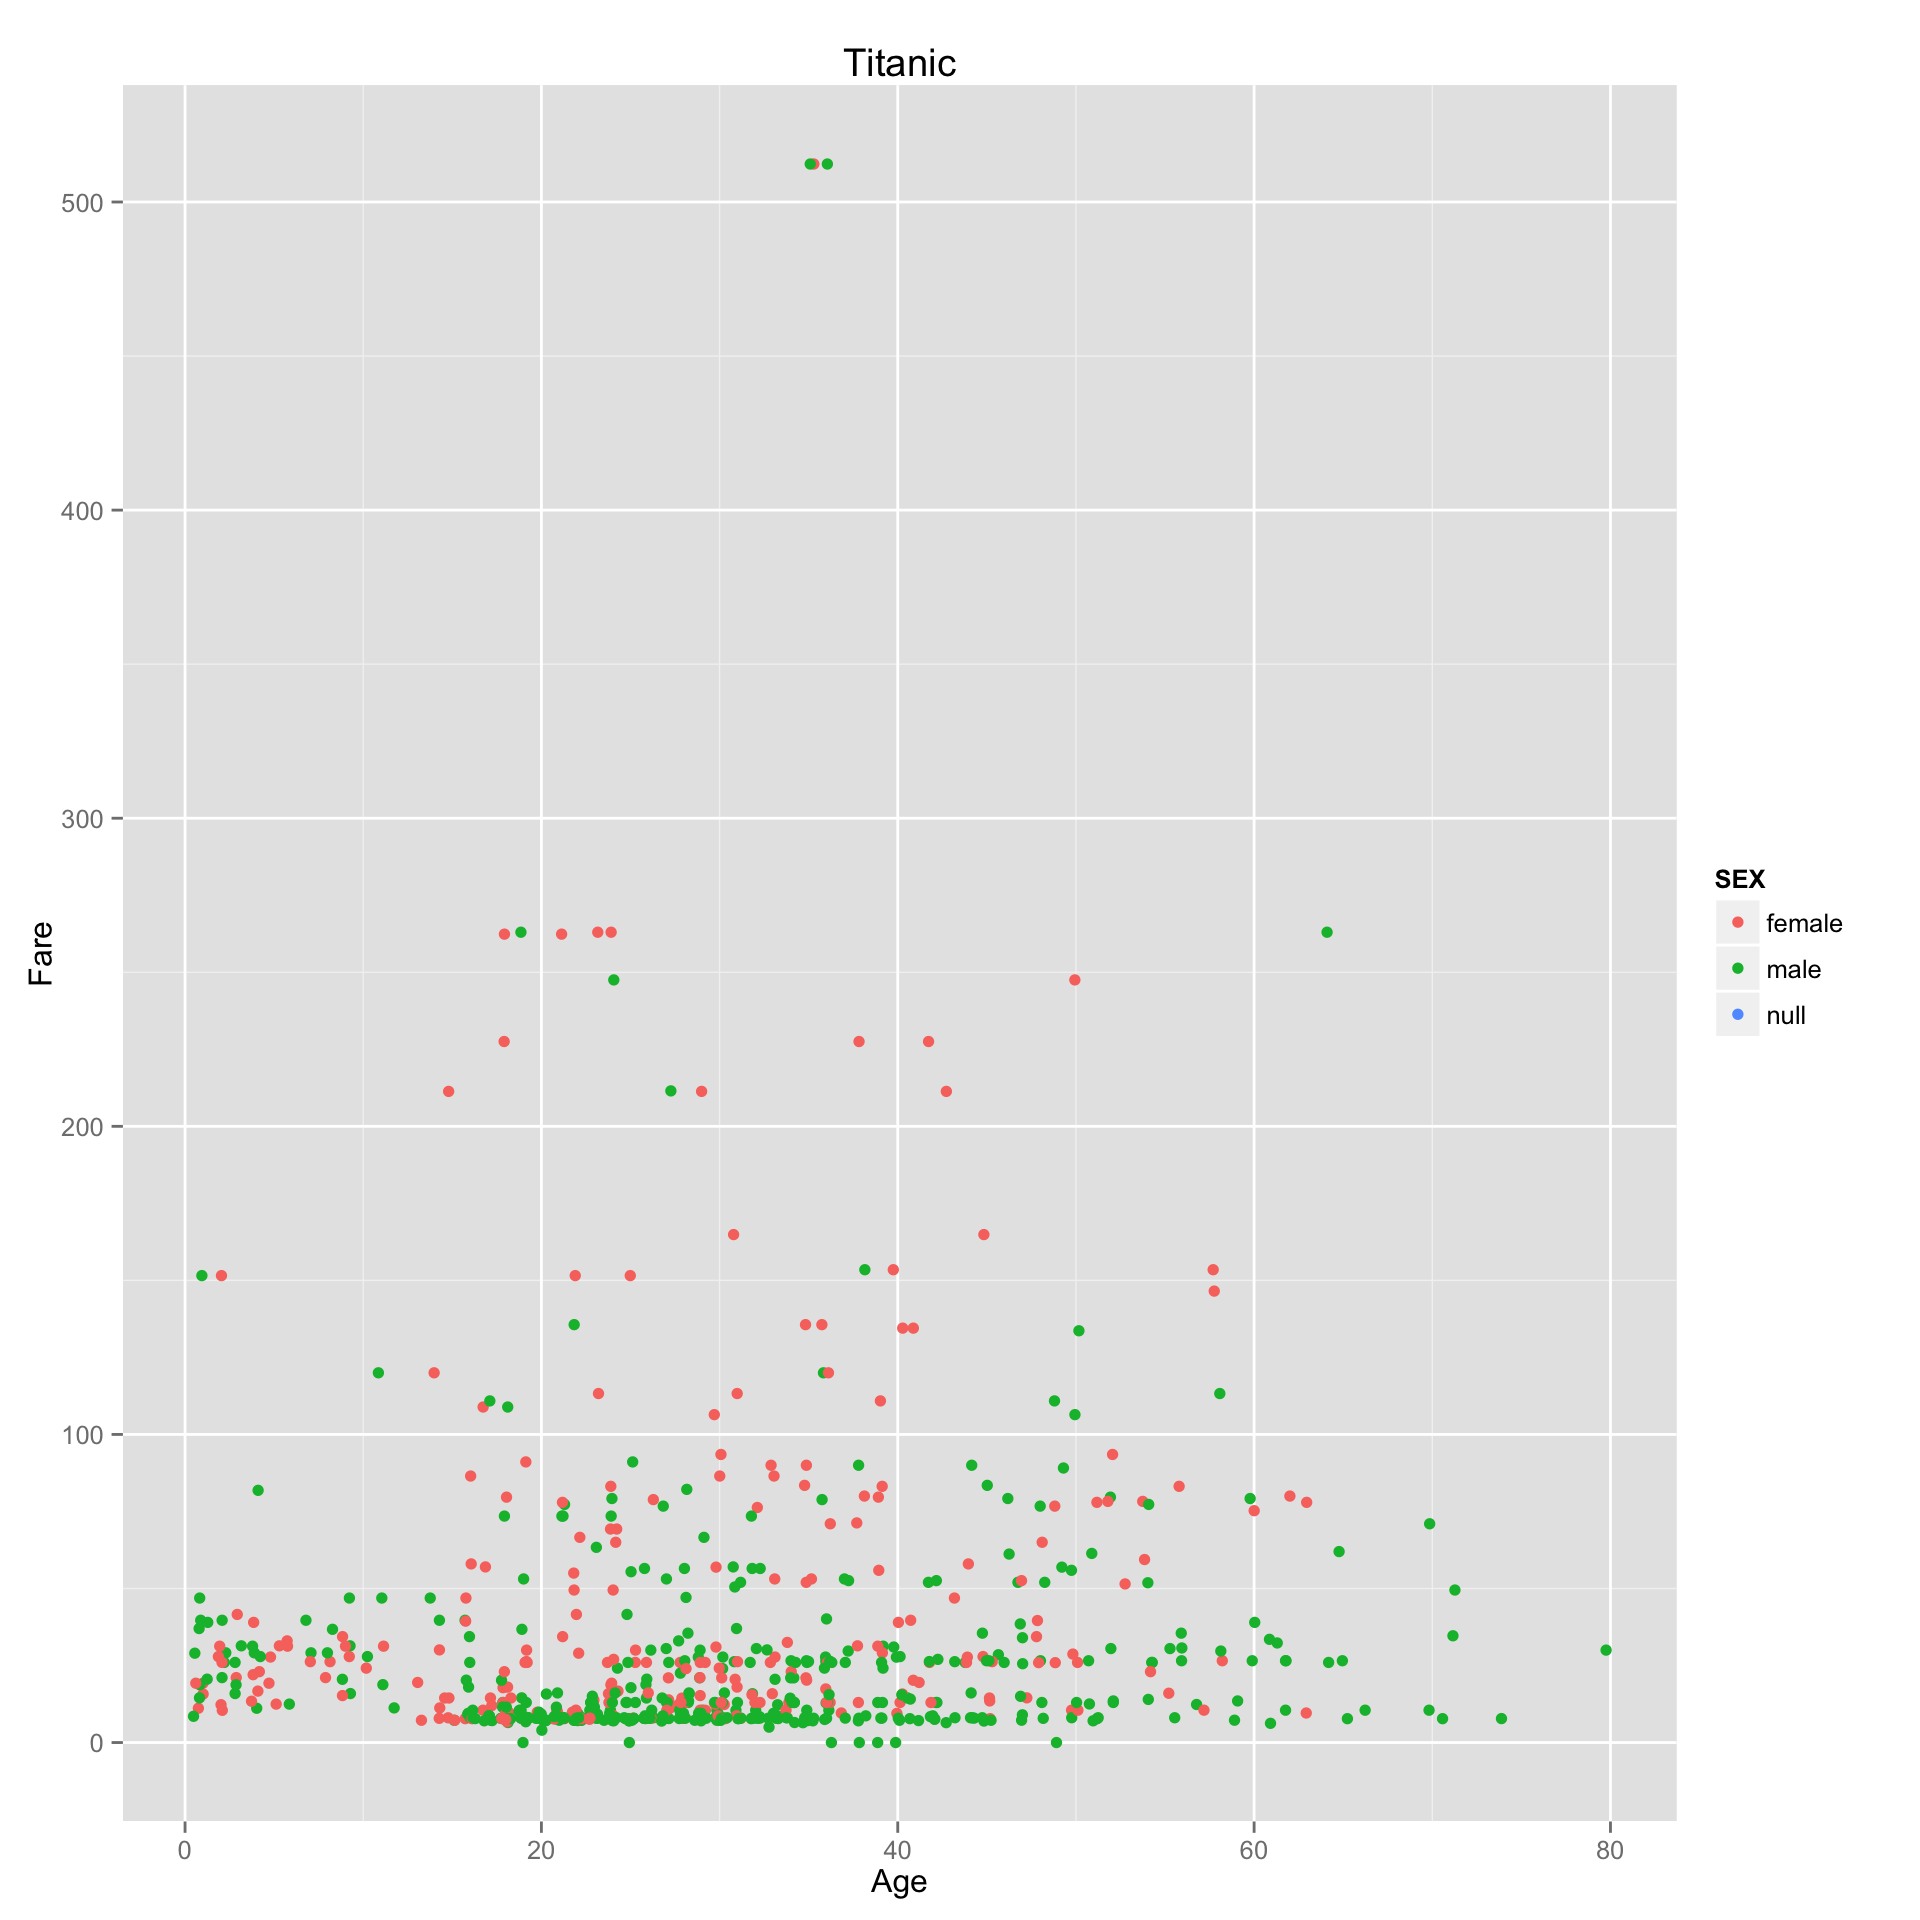
- Plot 1: Fare and Age of Titanic Passengers by Gender
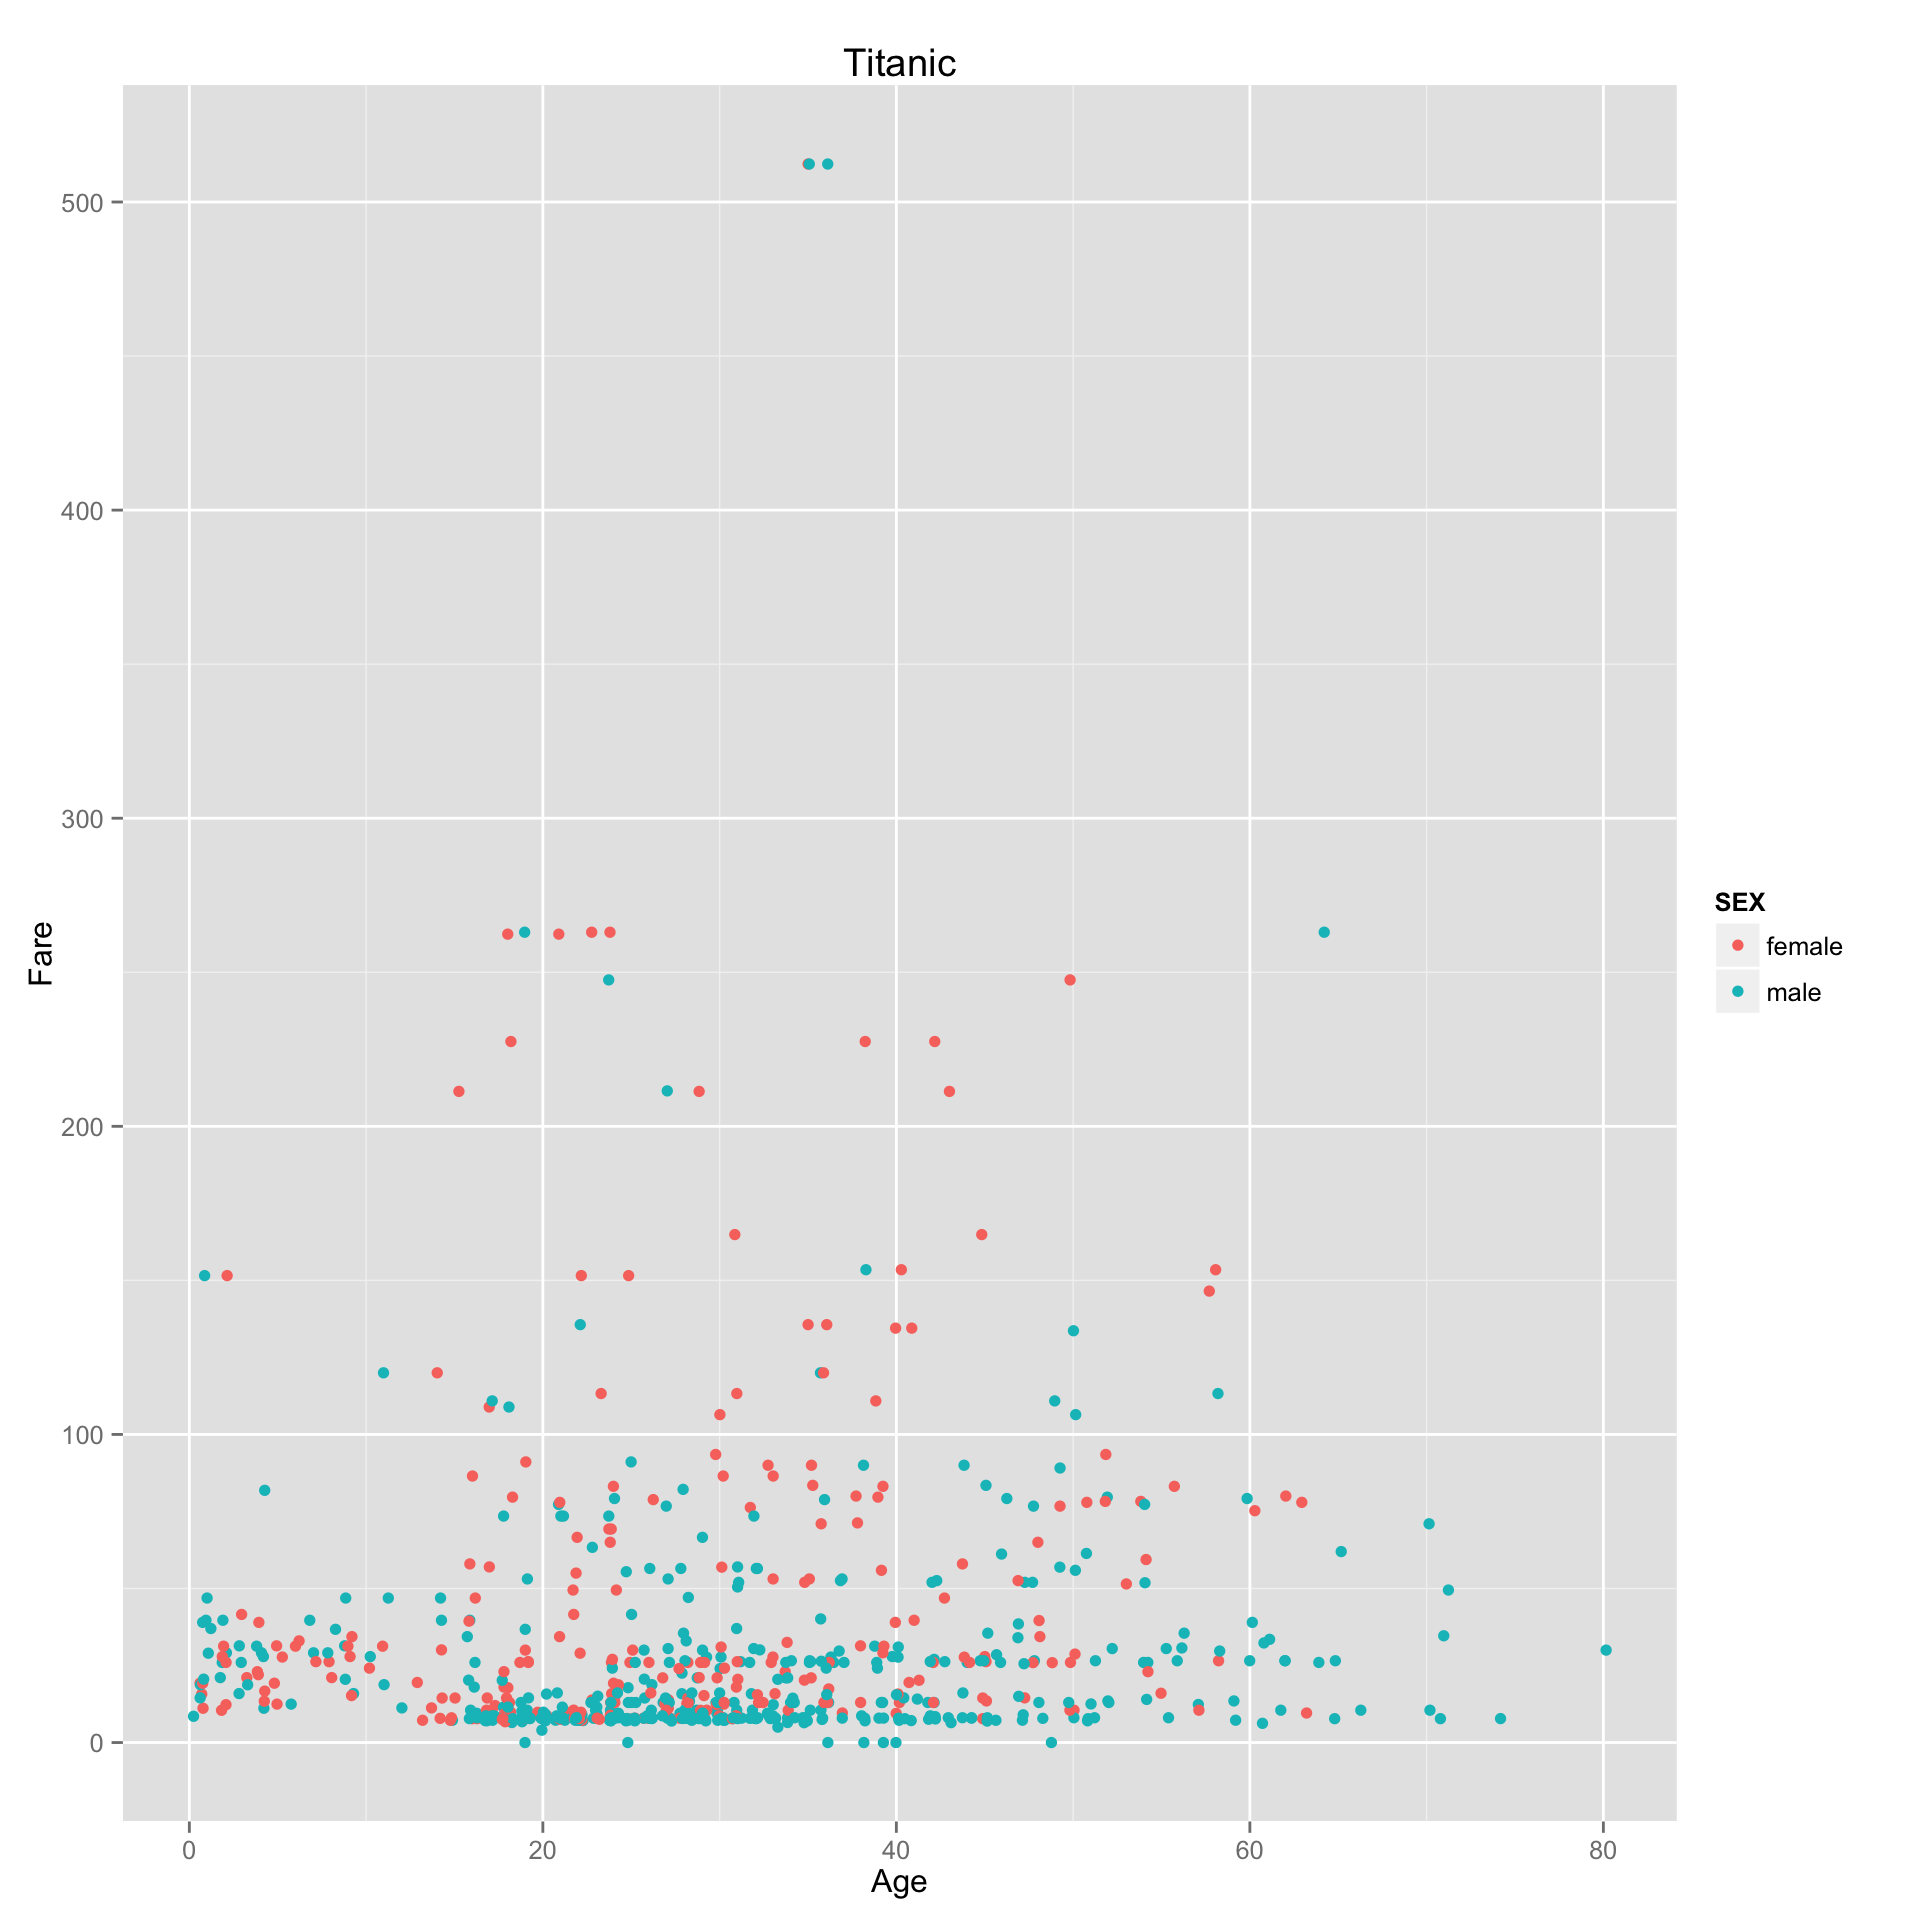
- Plot 2: Fare and Age of Titanic Passengers by Gender with no Null Gender
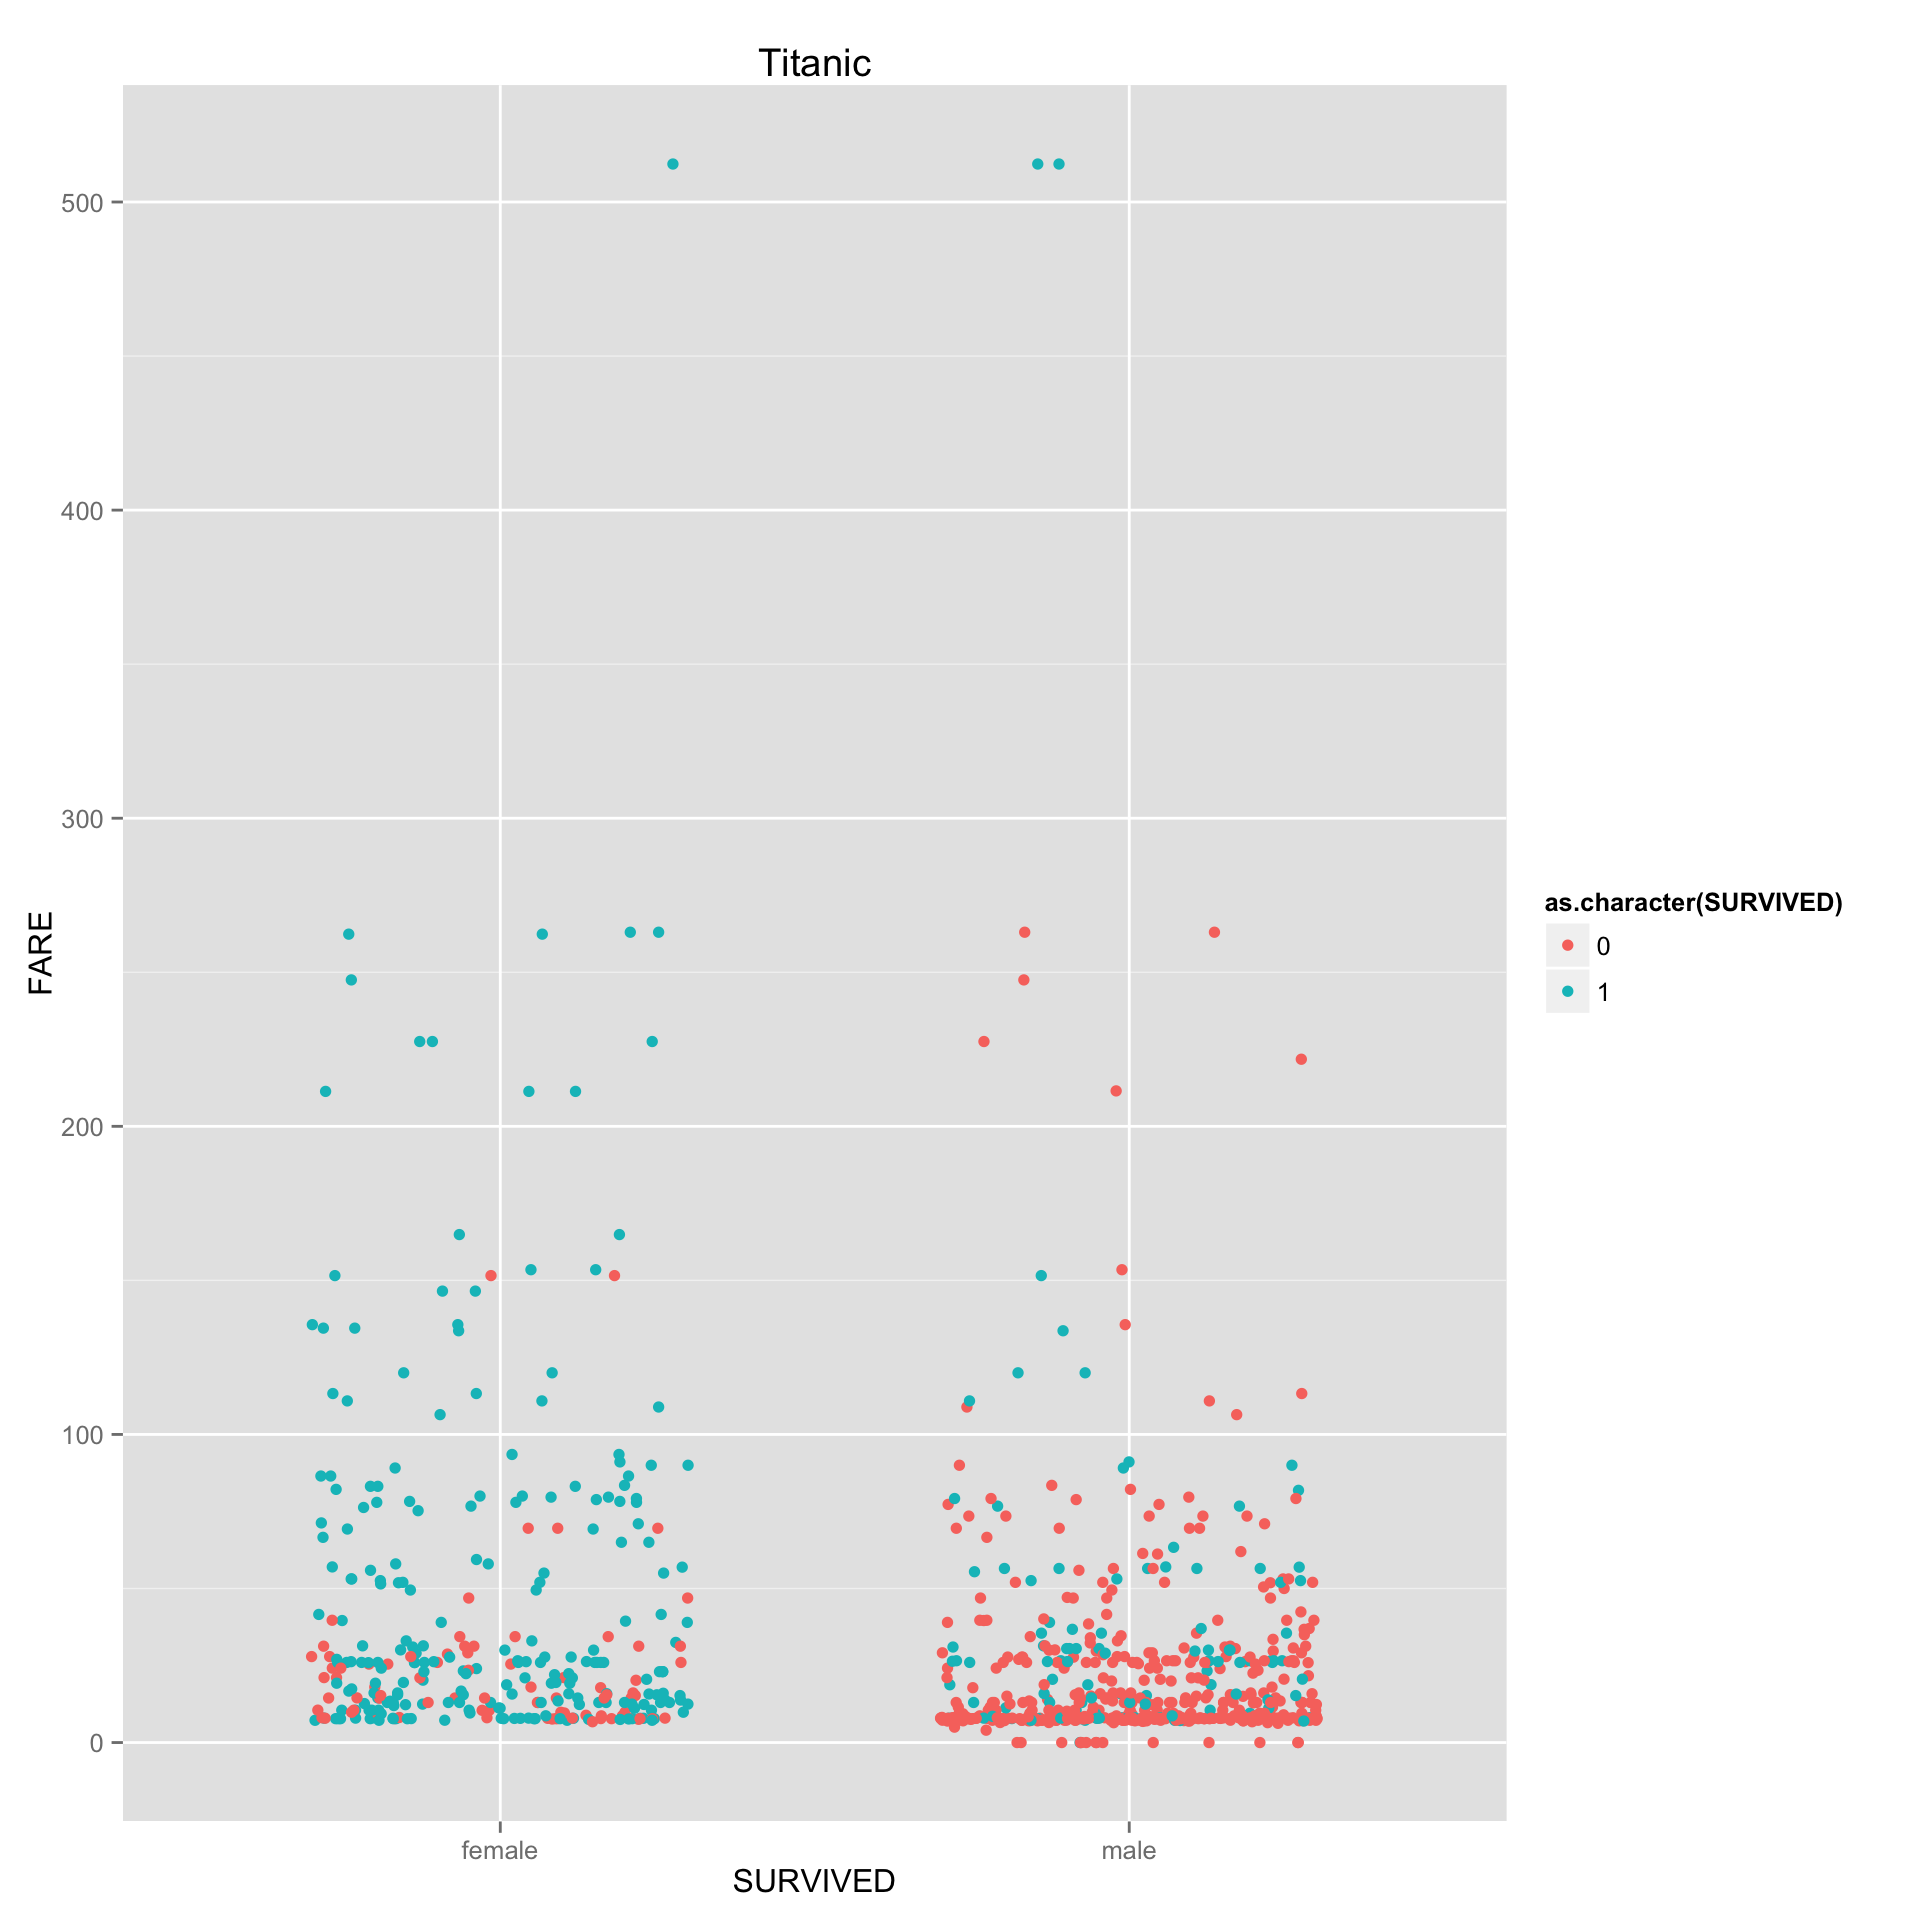
- Plot 3: Fare and Survival of Titanic Passengers by Gender
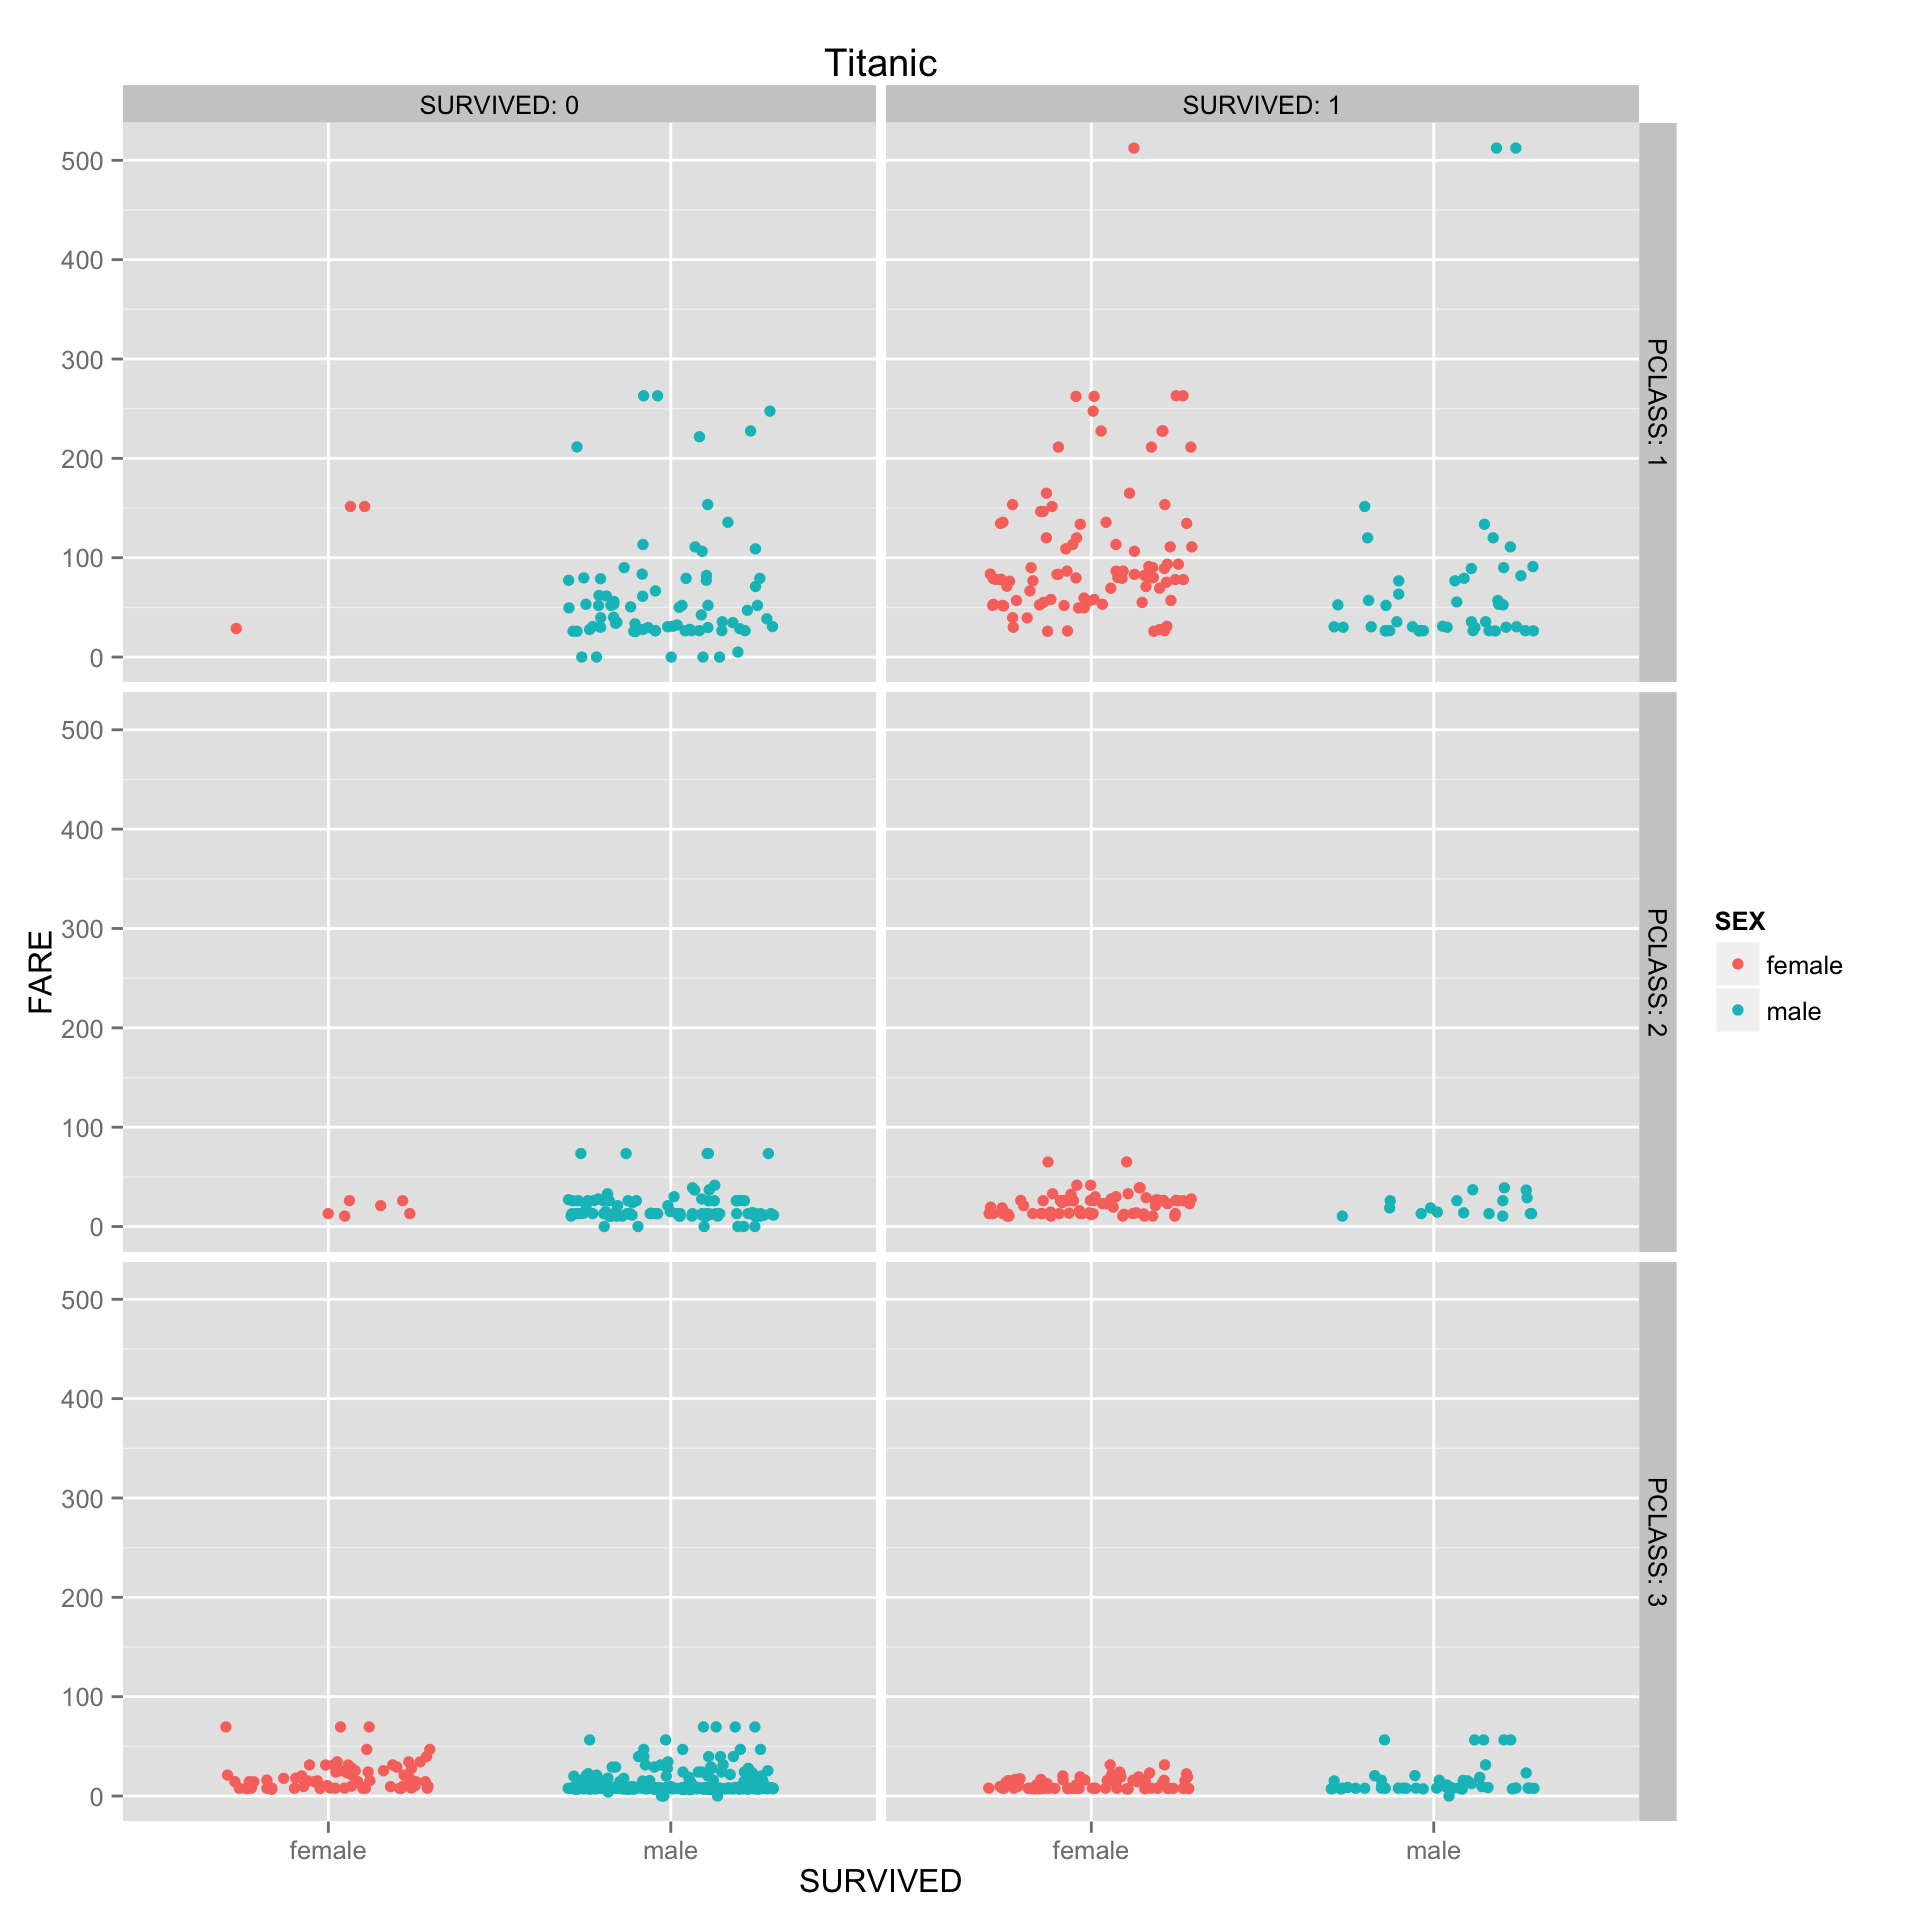
- Plot 4: Fare and Survival of Titanic Passengers by Gender and Passenger Class
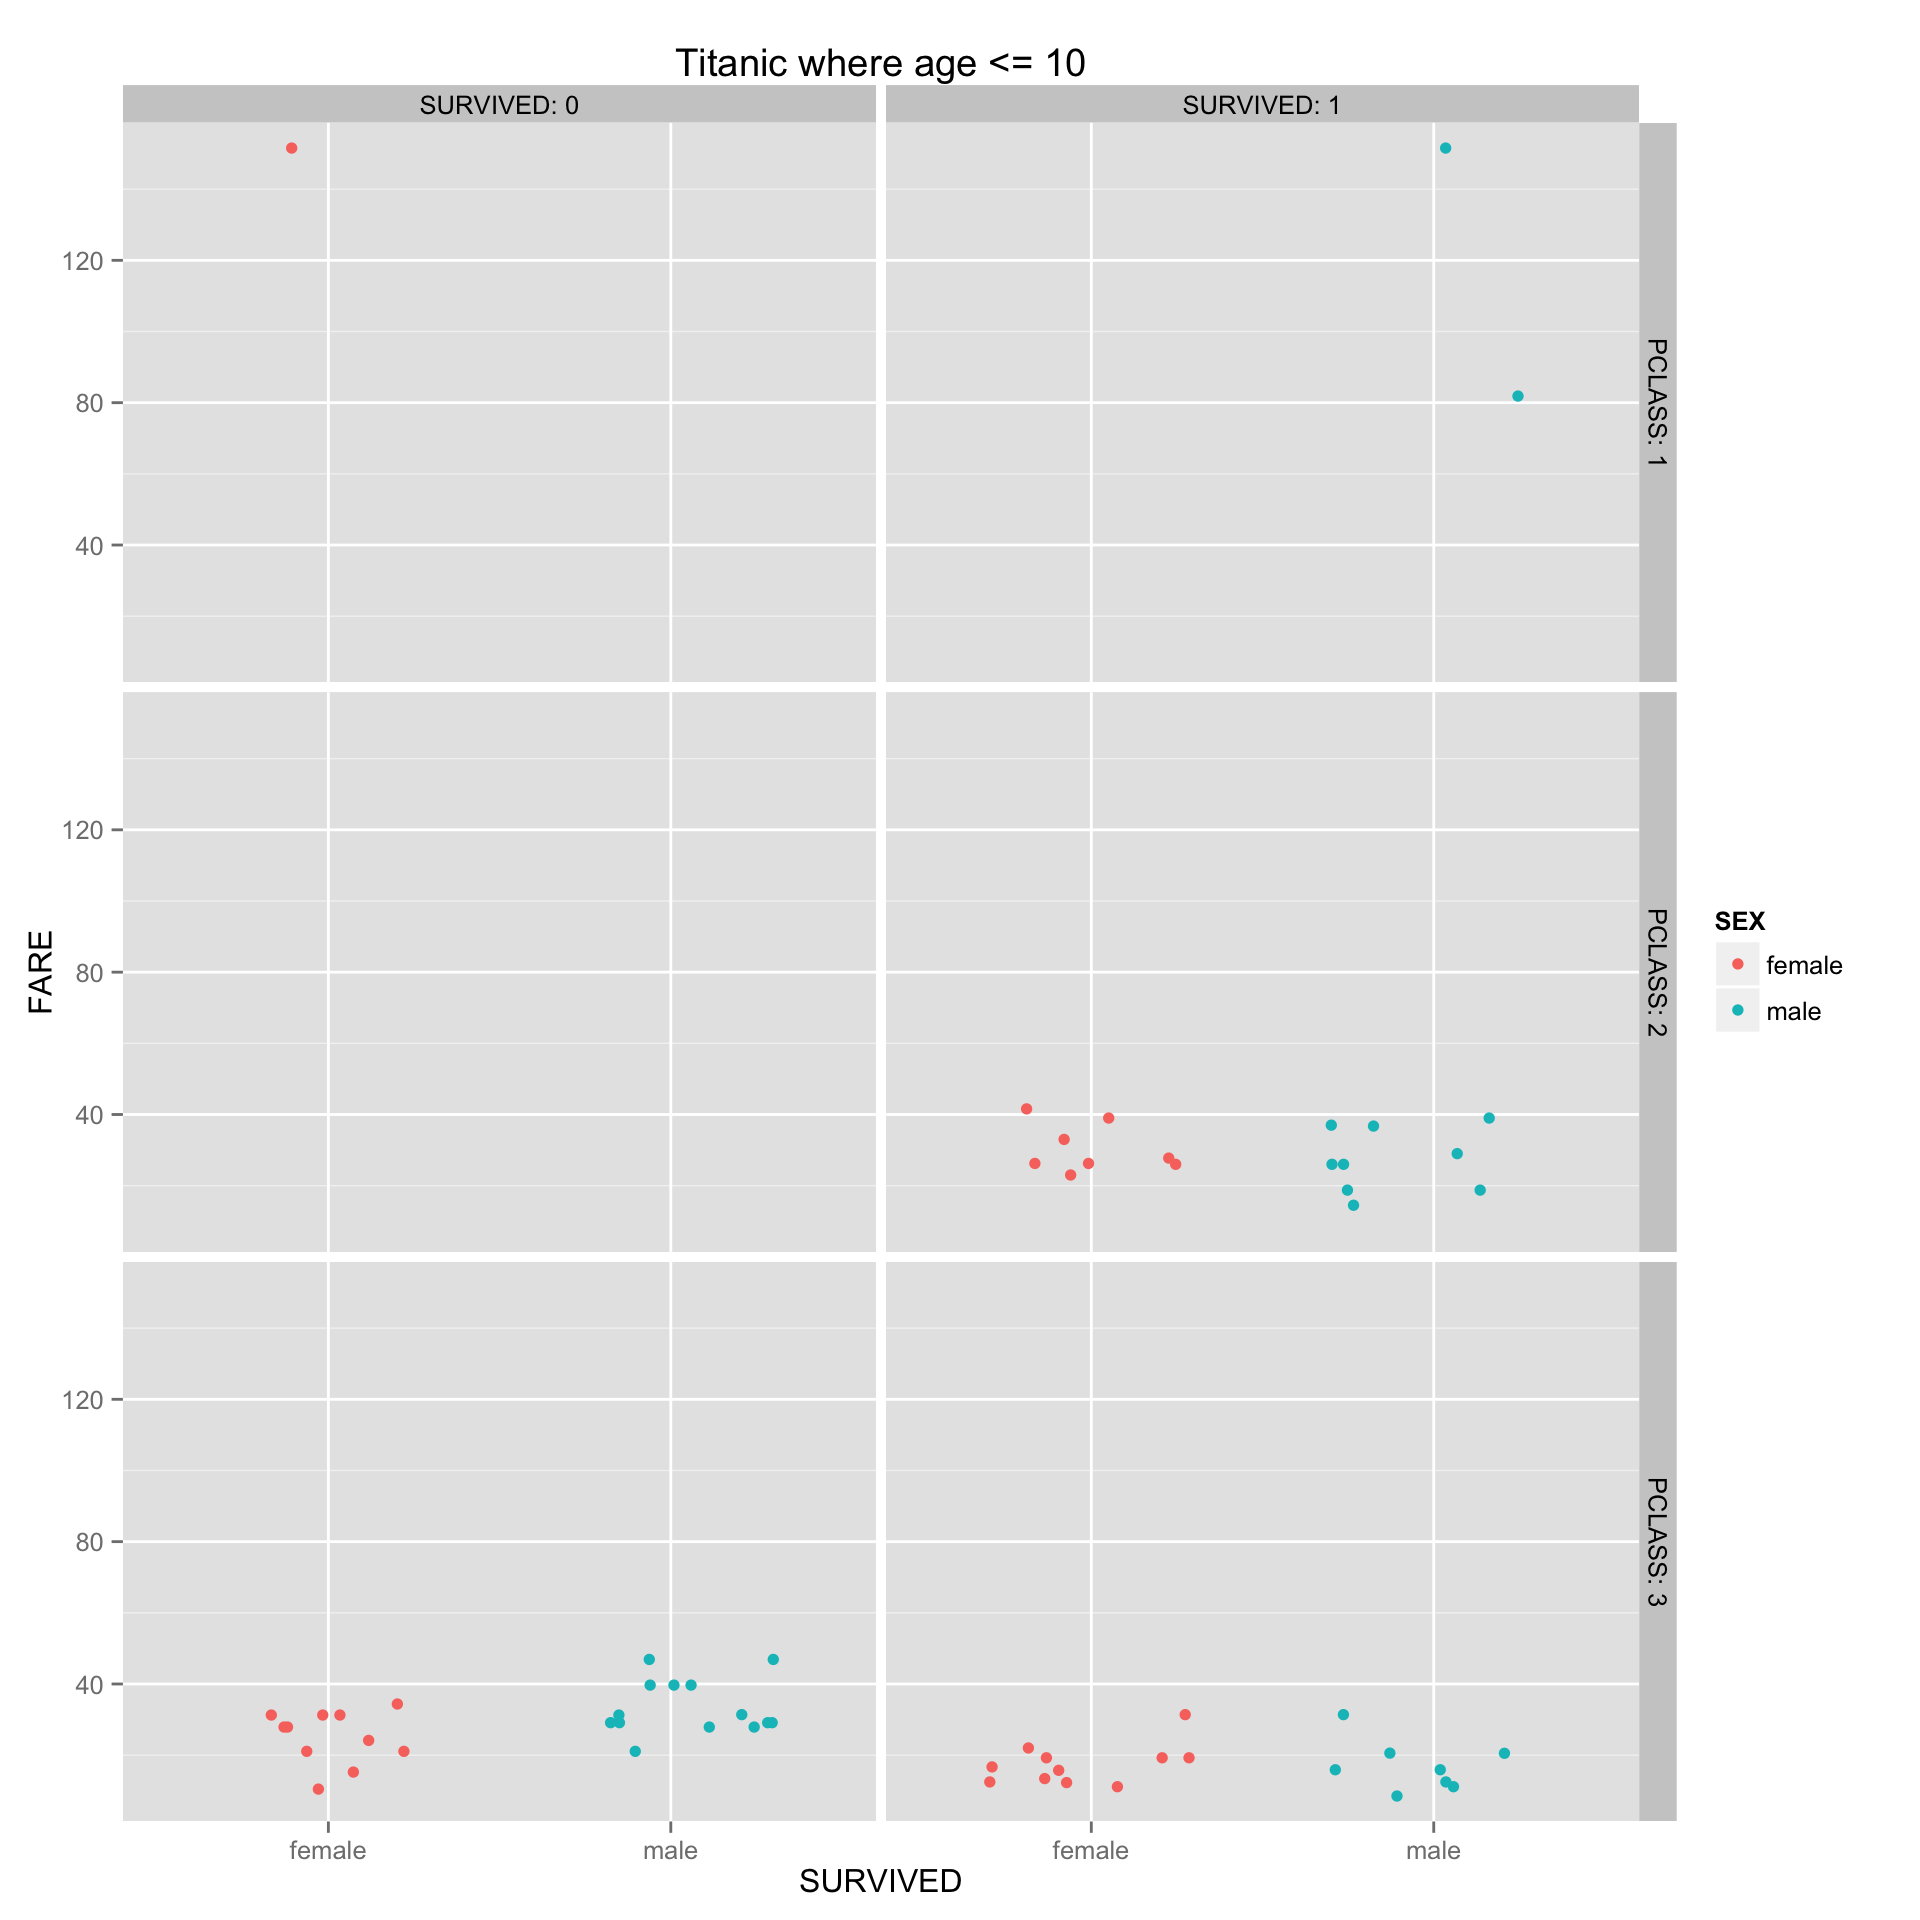
- Plot 5: Fare and Survival of Titanic Passengers 10 Years or younger by Gender
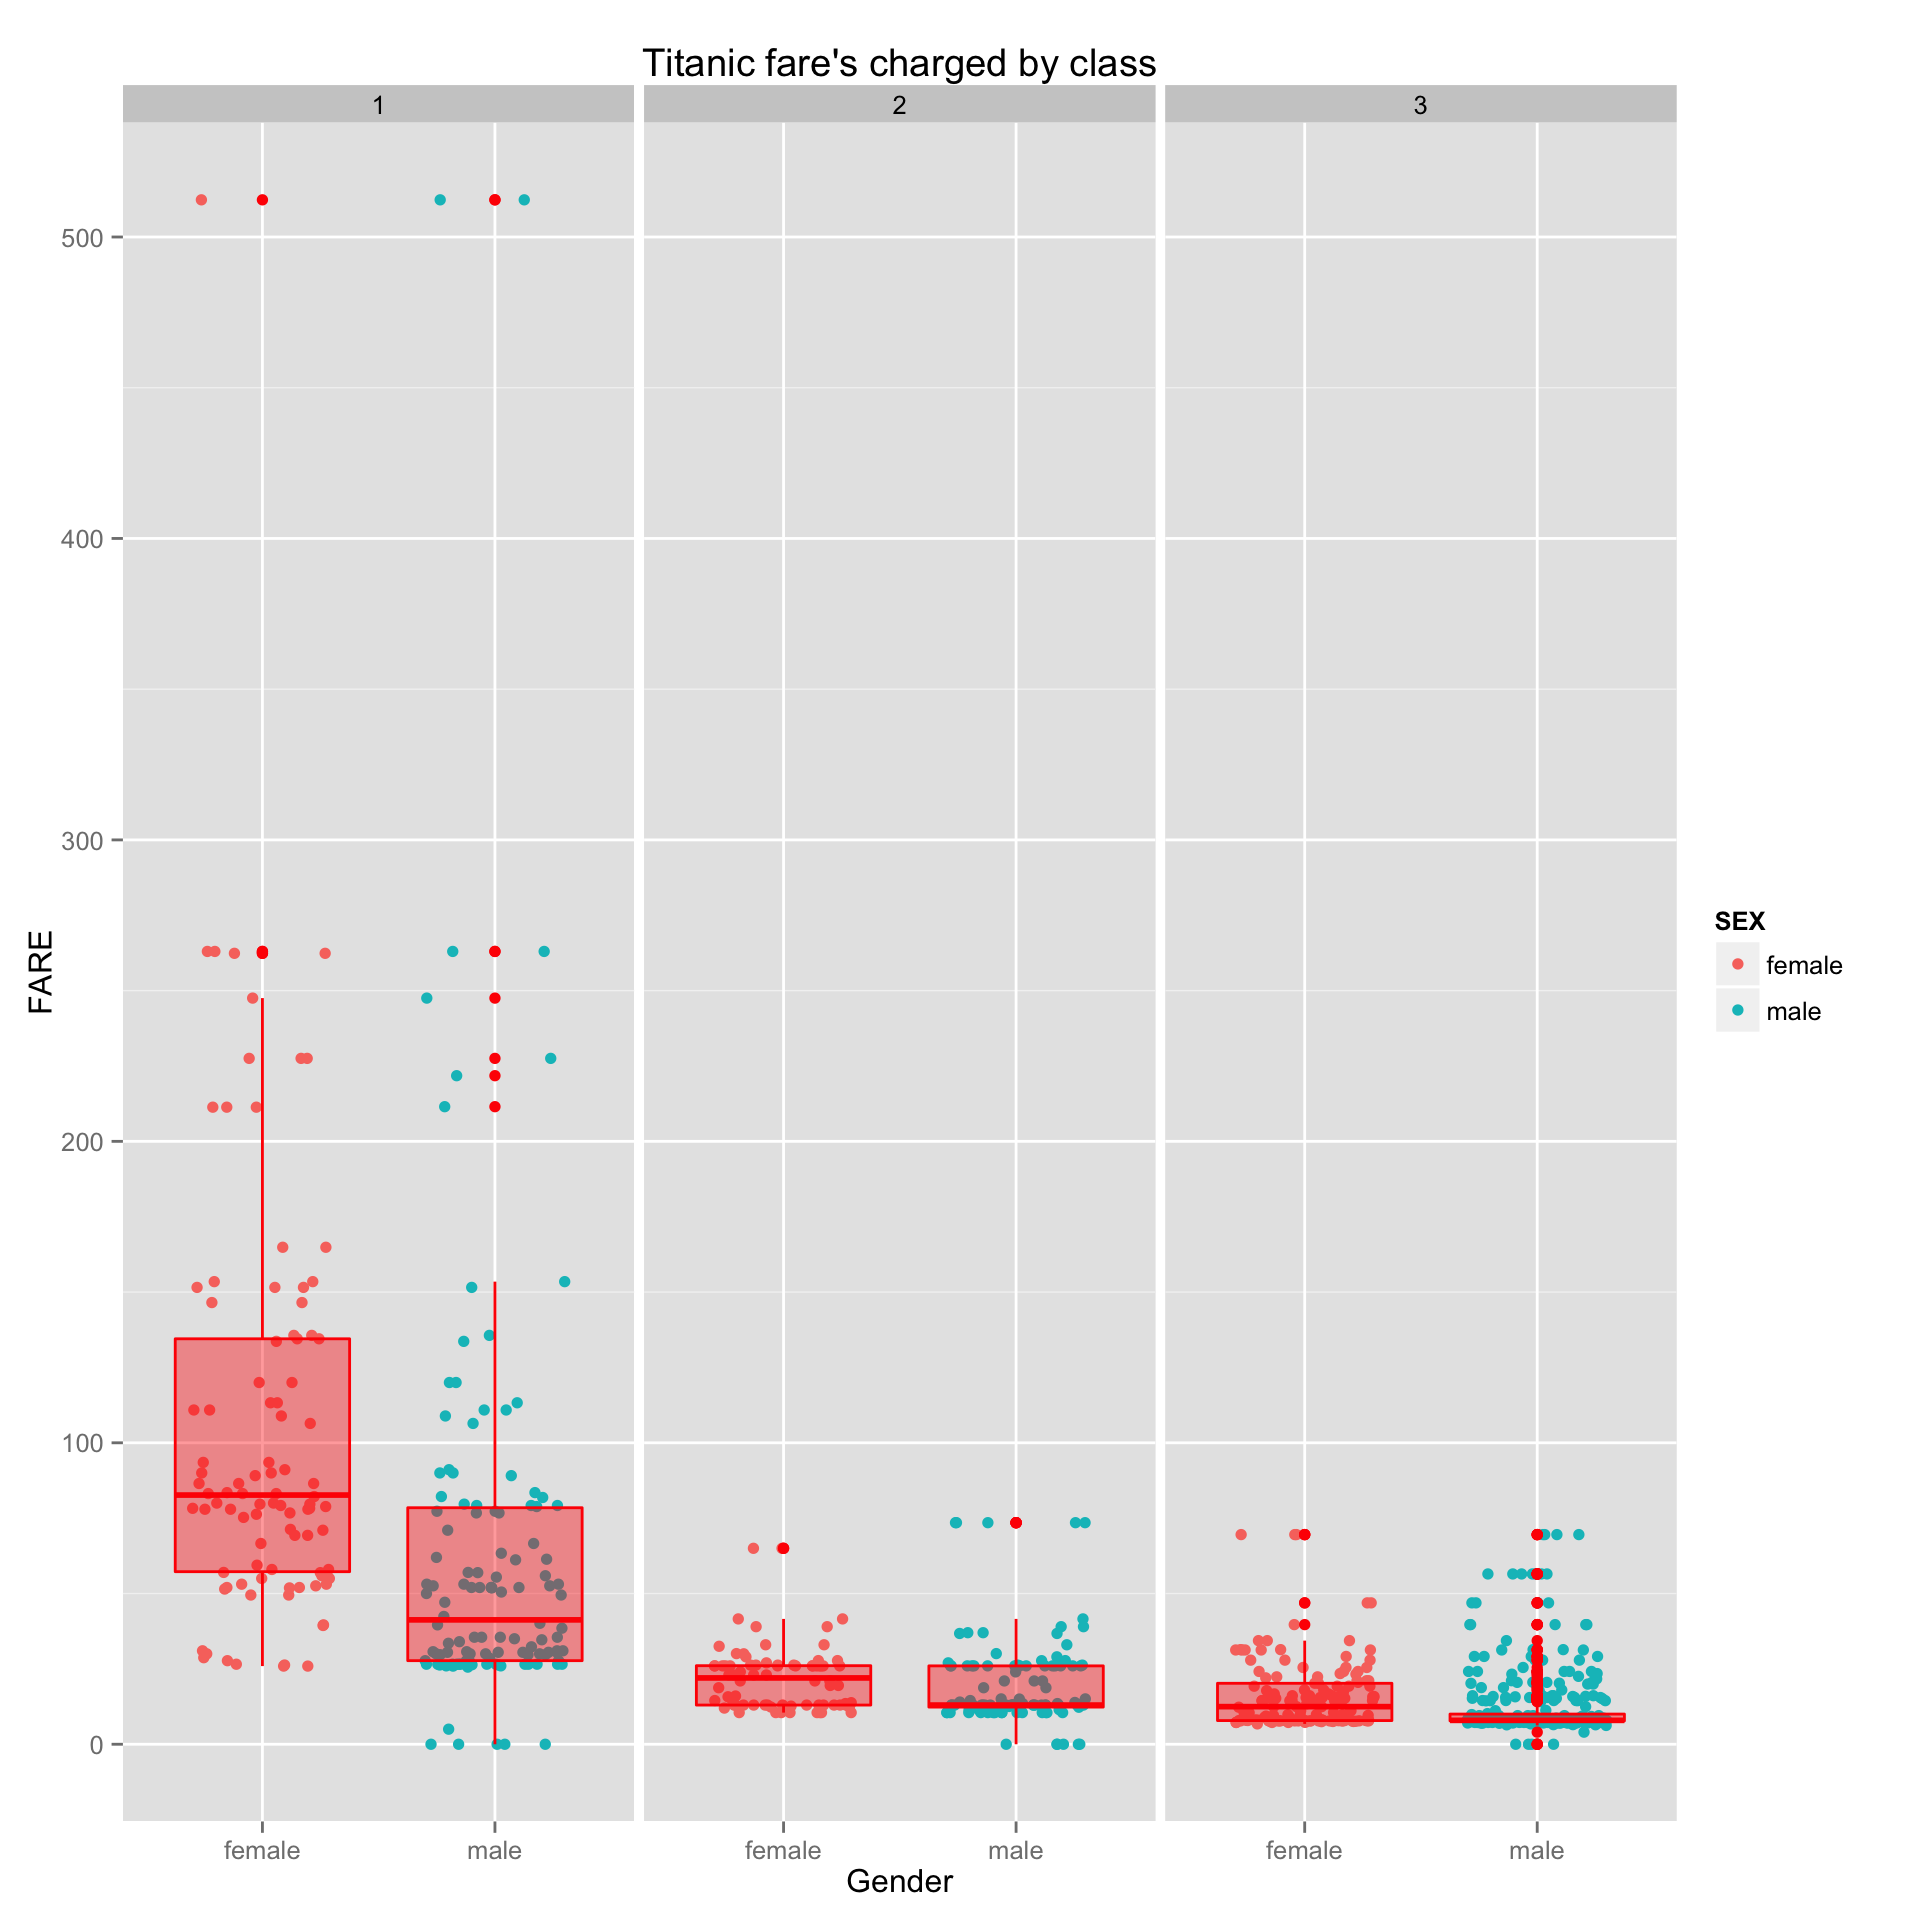
- Plot 6: Fare Charged by Gender and Passenger Class
Interesting Observations
Plot 6 produced the most interesting visualization. It confirmed the idea that on average, the lower your class, the lower the fare you pay. However, a rather surprising observation is that the difference in average price paid for second and third class passengers is so small that it appears that the average fare charged for a second class passenger is similar, if not the same, as the average fare charged for a third class passenger. Also, notice that for the first class passengers, the women had significantly larger average fares than their male passengers.