Data Visualization Static U.S. MPG

Project Description
This was the fourth Data Visualization project I did for my Elements of Data Visualization computer science course. There are a total of 5 plots in this project. The datasets come from the Environmental Projection Agency's Fuel Economy Data, which contains data on almost 37,000 different vehciles with many attributes to analyze. There was also a dataset called Car_Sales that contained the total number of cars sold in the U.S. from 1984 to 2014, which can be found at this website. There was an intermediate step that required Tableau, but these are the R versions of the graphs. I worked collaboratively on this project with my partner, Chenchao Zhang.
Project Details
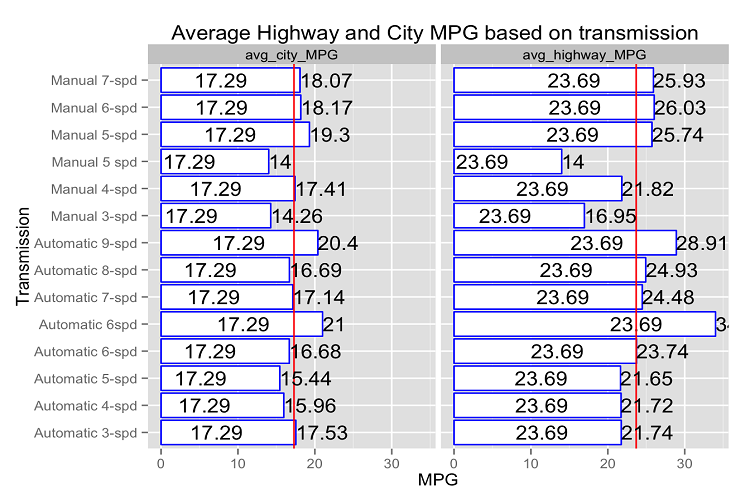
- Plot 1: Average MPG of Vehicles for each Type of Transmission
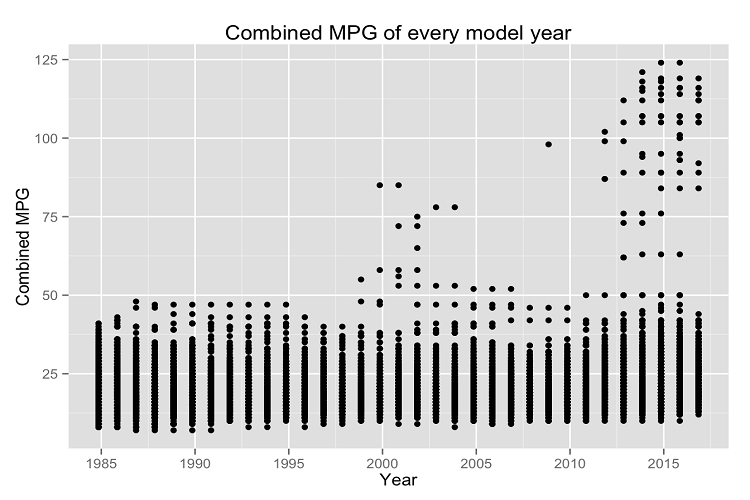
- Plot 2: Combined MPG of All Vehicles since 1984
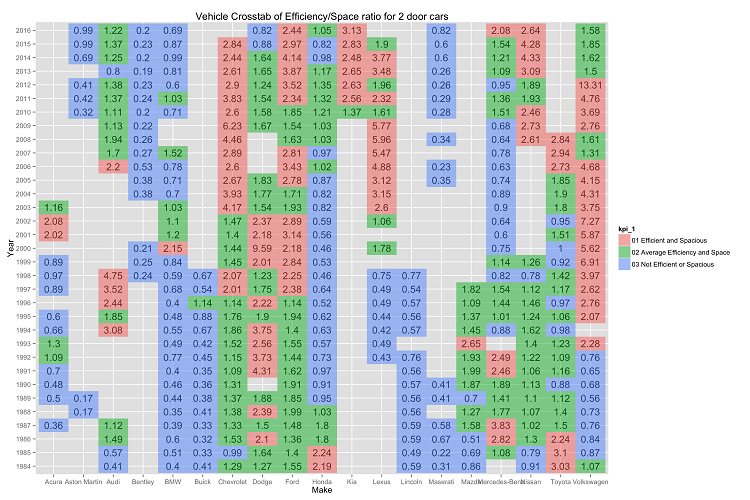
- Plot 3: KPI: MPG to Passenger Volumn Ratio for 2 door cars since 1984
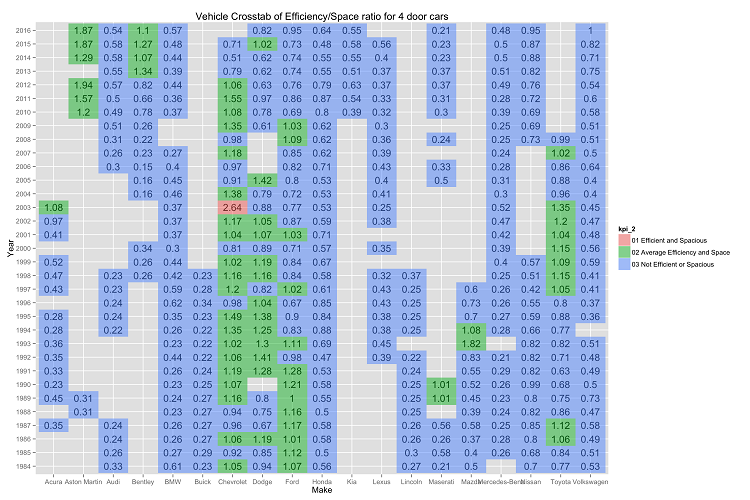
- Plot 4: KPI: MPG to Passenger Volumn Ratio fo 4 door cars since 1984
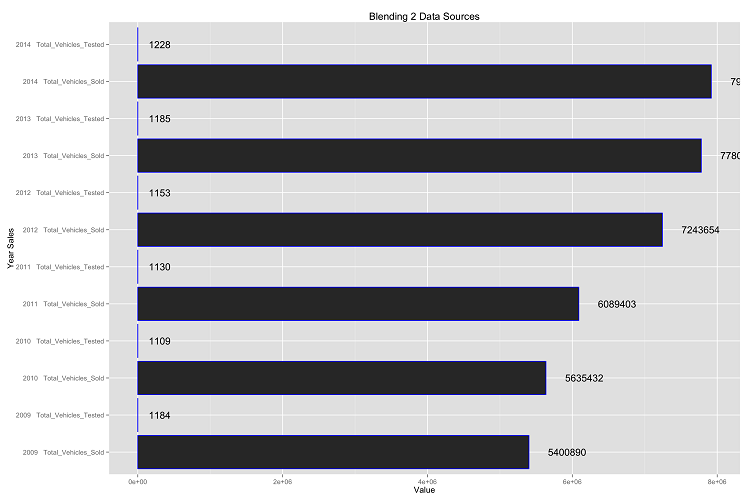
- Plot 5: Relationship between Vehicles tested and Sales of Cars in U.S.
Interesting Observations
Plot 1 showed that automatic transmissions produces a higher average MPG than a manual transmission car, which goes against the conventional wisdom that manual cars have better gas mileage. Plot 2 showed that while the overall long term trend of the average MPG of model year cars has increased over the years, there are periods of time where the average MPG actually decreases, most notablly between 1998 to 2003 which coincidentally occurs with low prices of gasoline. Plot 3 uses a Key Performance Indicator (KPI) to demostrate what manufacturers produced 2 door cars that were efficient (high combined MPG) and spacious (measured by vehicle passenger volumn). The fourth plot uses a Key Performance Indicator (KPI) to show what manufacturers have a portfolio of 4 door cars that were efficent and spacious. The last plot showed that while the EPA has only managed to roughly test the same number of vehciles from 2009-2014, the number of vehicles sold in the U.S. during that time has increased nearly 50%.